Monday 21 December 2015

EURUSD last retracement of the year


Hi Traders,

Next 2-3 weeks should probably display a very thin market. However, the EURUSD (now at 1.08666), should slide slowly to the area at 1.0705-1.0690 before resuming the main uptrend.


TARGETS:

first down to the area at 1.0705-1.0690

then up to
1) 1.1101
2) 1.1387
3) 1.1680

ELLIOTT WAVES

The monthly and weekly chart show that the giant 
​ retracement wave 
​"
abc-X-abc
​"​

​ (or 3-3-5​)
 ended in March 2015
​.​
​ ​


​This implied
 

a retracement of 71%
​ and ​
the end of the 
​major ​
downtrend started in July 2008
​.​


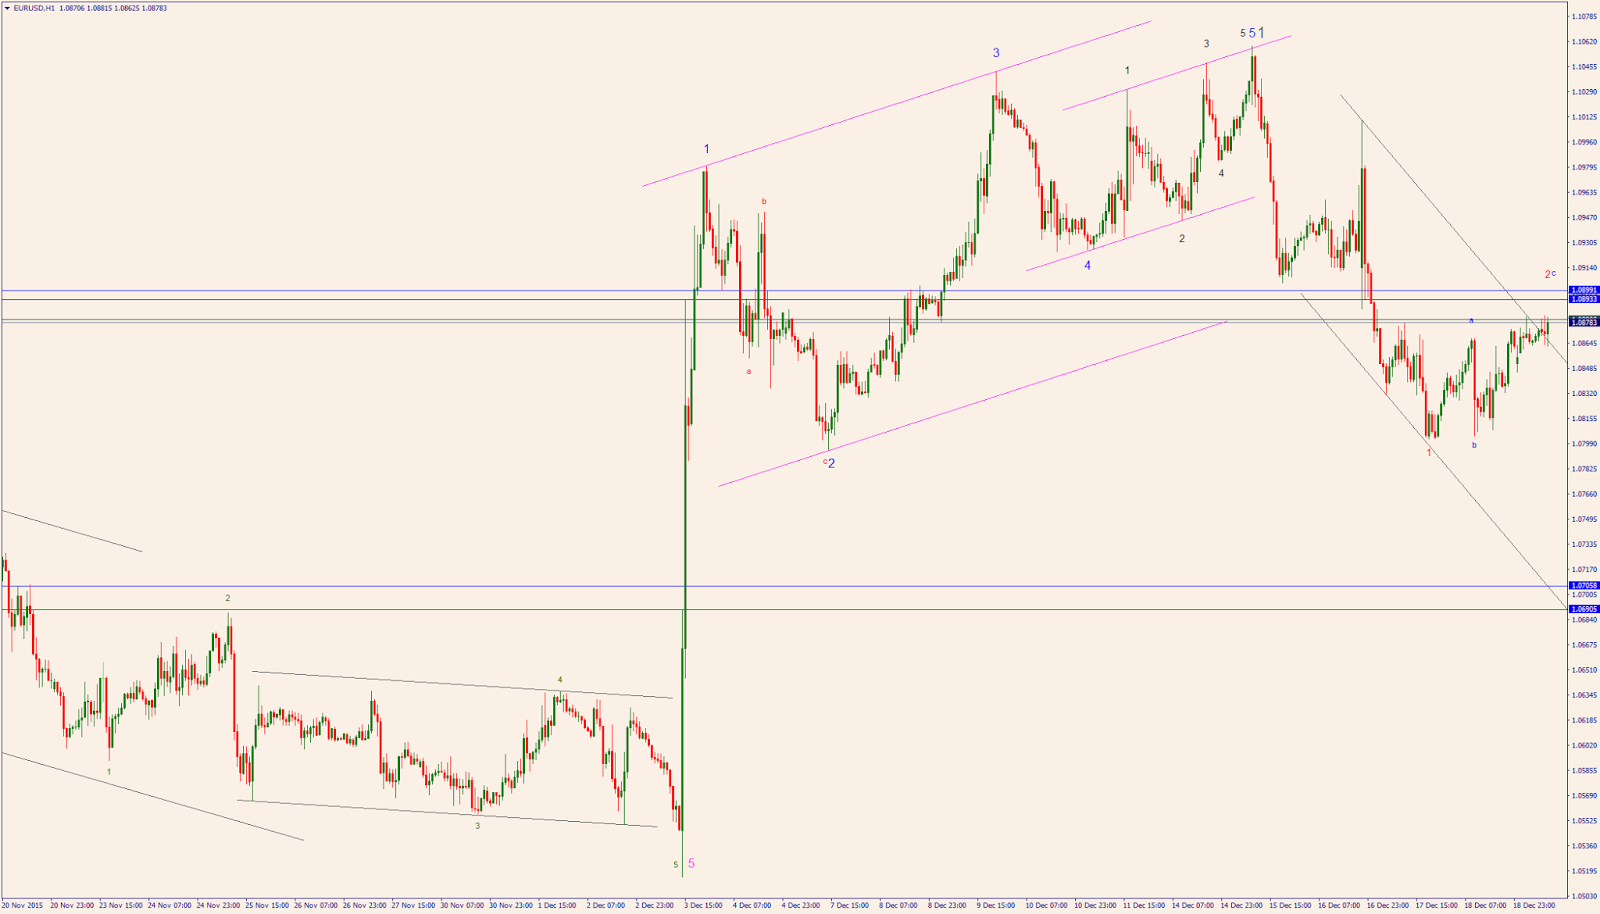
As displayed in the 4-hour and 1-hour charts, the  EURUSD also completed the very first wave of the new uptrend and it's now

​​
 very close to 
​the ​
end 
​of ​
the subsequent retracement wave 2 in the area at 1.0705-1.0690.

That area should see the beginning of the new wave 3 up.


monthly chart - click to enlarge


weekly chart - click to enlarge


daily chart - click to enlarge


4-hour chart - click to enlarge


1-hour chart - click to enlarge


Monday 14 December 2015

Jade Capital Partners

Hi Traders,


For your knowledge, this is what I do. For more details contact me or Jade Capital Partners by following the link below.


GOLD: the end of the downtrend?

Hi Traders,

For the last 2.5 years I repeated that Gold (now at 1076) was going to bottom down in the area 1032-1044. It actually touched the support at 1046 on Dec 03 and finally reversed a downtrend lasting since Sept 06, 2011.


If this analysis is correct we just started a new major uptrend that should take it to the area at 1520-1530.

NOTE: The Elliott Wave Analysts usually work on a possible alternative waves count. It's worth noting that both configurations point upwards, although the secondary target is limited to level 1307. 


CLOSE  RANGE TARGETS: 

a) 1098

b) 1129
c) 1170


LONG RANGE TARGETS: 

a) 1322-1334

b) 1431
c) 1520-1530


ELLIOTT WAVES

The monthly and weekly charts display the lowest low at 1046 i.e. very close to the suggested target area at 1044-1032. 
Note the blue lines (targets) in both charts.


The daily chart shows the very end of the 4 years trend (51 months). The 4-hour and 1-hour charts display a possible entry point at 1069.50 (blue line).


Monthly chart, click to enlarge


Weekly chart, click to enlarge


Daily chart, click to enlarge


4-hour chart, click to enlarge


1-hour chart, click to enlarge


Monday 23 November 2015

MONDAY IN BRIEF: AUDUSD, EURUSD, GOLD, and SPI200

Hi Traders,

Welcome to Monday in Brief. Please, see the charts after the short comment. Some targets below might take a while to be fetched. For more info, fell free to call Jade Capital Partners

In Brief:

The AUDUSD (now at 0.7234) seems to be retracing a bit down to 0.7155 and then top around 0.7300. Subsequently it should resume the downtrend to 0.6855. 

If the EURUSD (now at 1.0634) bottoms down at 1.0566, it should start a rebound up to 1.1041-1.1090. If it goes through that support at 1.0566 it might move down to 1.01-1.02.

GOLD (now at 1077) might temporarily move up a bit but is still weak and heading down to the area at 1041-1.034 or even 1009-989 before starting the new uptrend. 

Finally, even if the SPI200 (now at 5265) retrace a bit to 5160-5147, it should reach the target at 5650-5687 very soon.


AUDUSD daily, click to enlarge


EURUSD 4-hour, click to enlarge


GOLD weekly, click to enlarge


SPI200 weekly, click to enlarge


Friday 30 October 2015

EURUSD soon topping at 1.18-1.19?

Hi Traders,

In the very short term (see the 15 min chart) the EURUSD (now at 1.0932) is set to top within the area 1.1014-1.1026 before resuming a minor downtrend to 1.085-1.082.

Once reached this bottom at 1.085-1.082 it might start a temporary uptrend to the area 1.1778-1.1964 (see target in the daily chart).

Overall, the long term target is still down to the area 1.0330-1.0098 (see target in the monthly chart)


TARGETS

first
up to 1.1014-1.1026 and then down to 1.085-1.082
then again
up to the area 1.1778-1.1964

ELLIOTT WAVES

The daily chart displays a continuation pattern that should develop in 7 waves, 5 of them already on the daily chart. In few words, wave 6 should reach the low at 1.085-1.082 whilst wave 7 should top in the area 1.1778-1.1964 (see monthly chart for this target). This new top would complete wave W. 


monthly chart - click the chat to enlarge


weekly chart - click the chat to enlarge


daily chart - click the chat to enlarge


4-hour chart - click the chat to enlarge


1-hour chart - click the chat to enlarge


15 min chart - click the chat to enlarge