Tuesday 26 July 2022

BITCOIN LAST DIVE?

 Hi Traders,

After a small retracement up to 24-25000 Bitcoin (now at 23330) could be staging a sell off that will ultimately take it to 12000. However, this should be the last major dive.
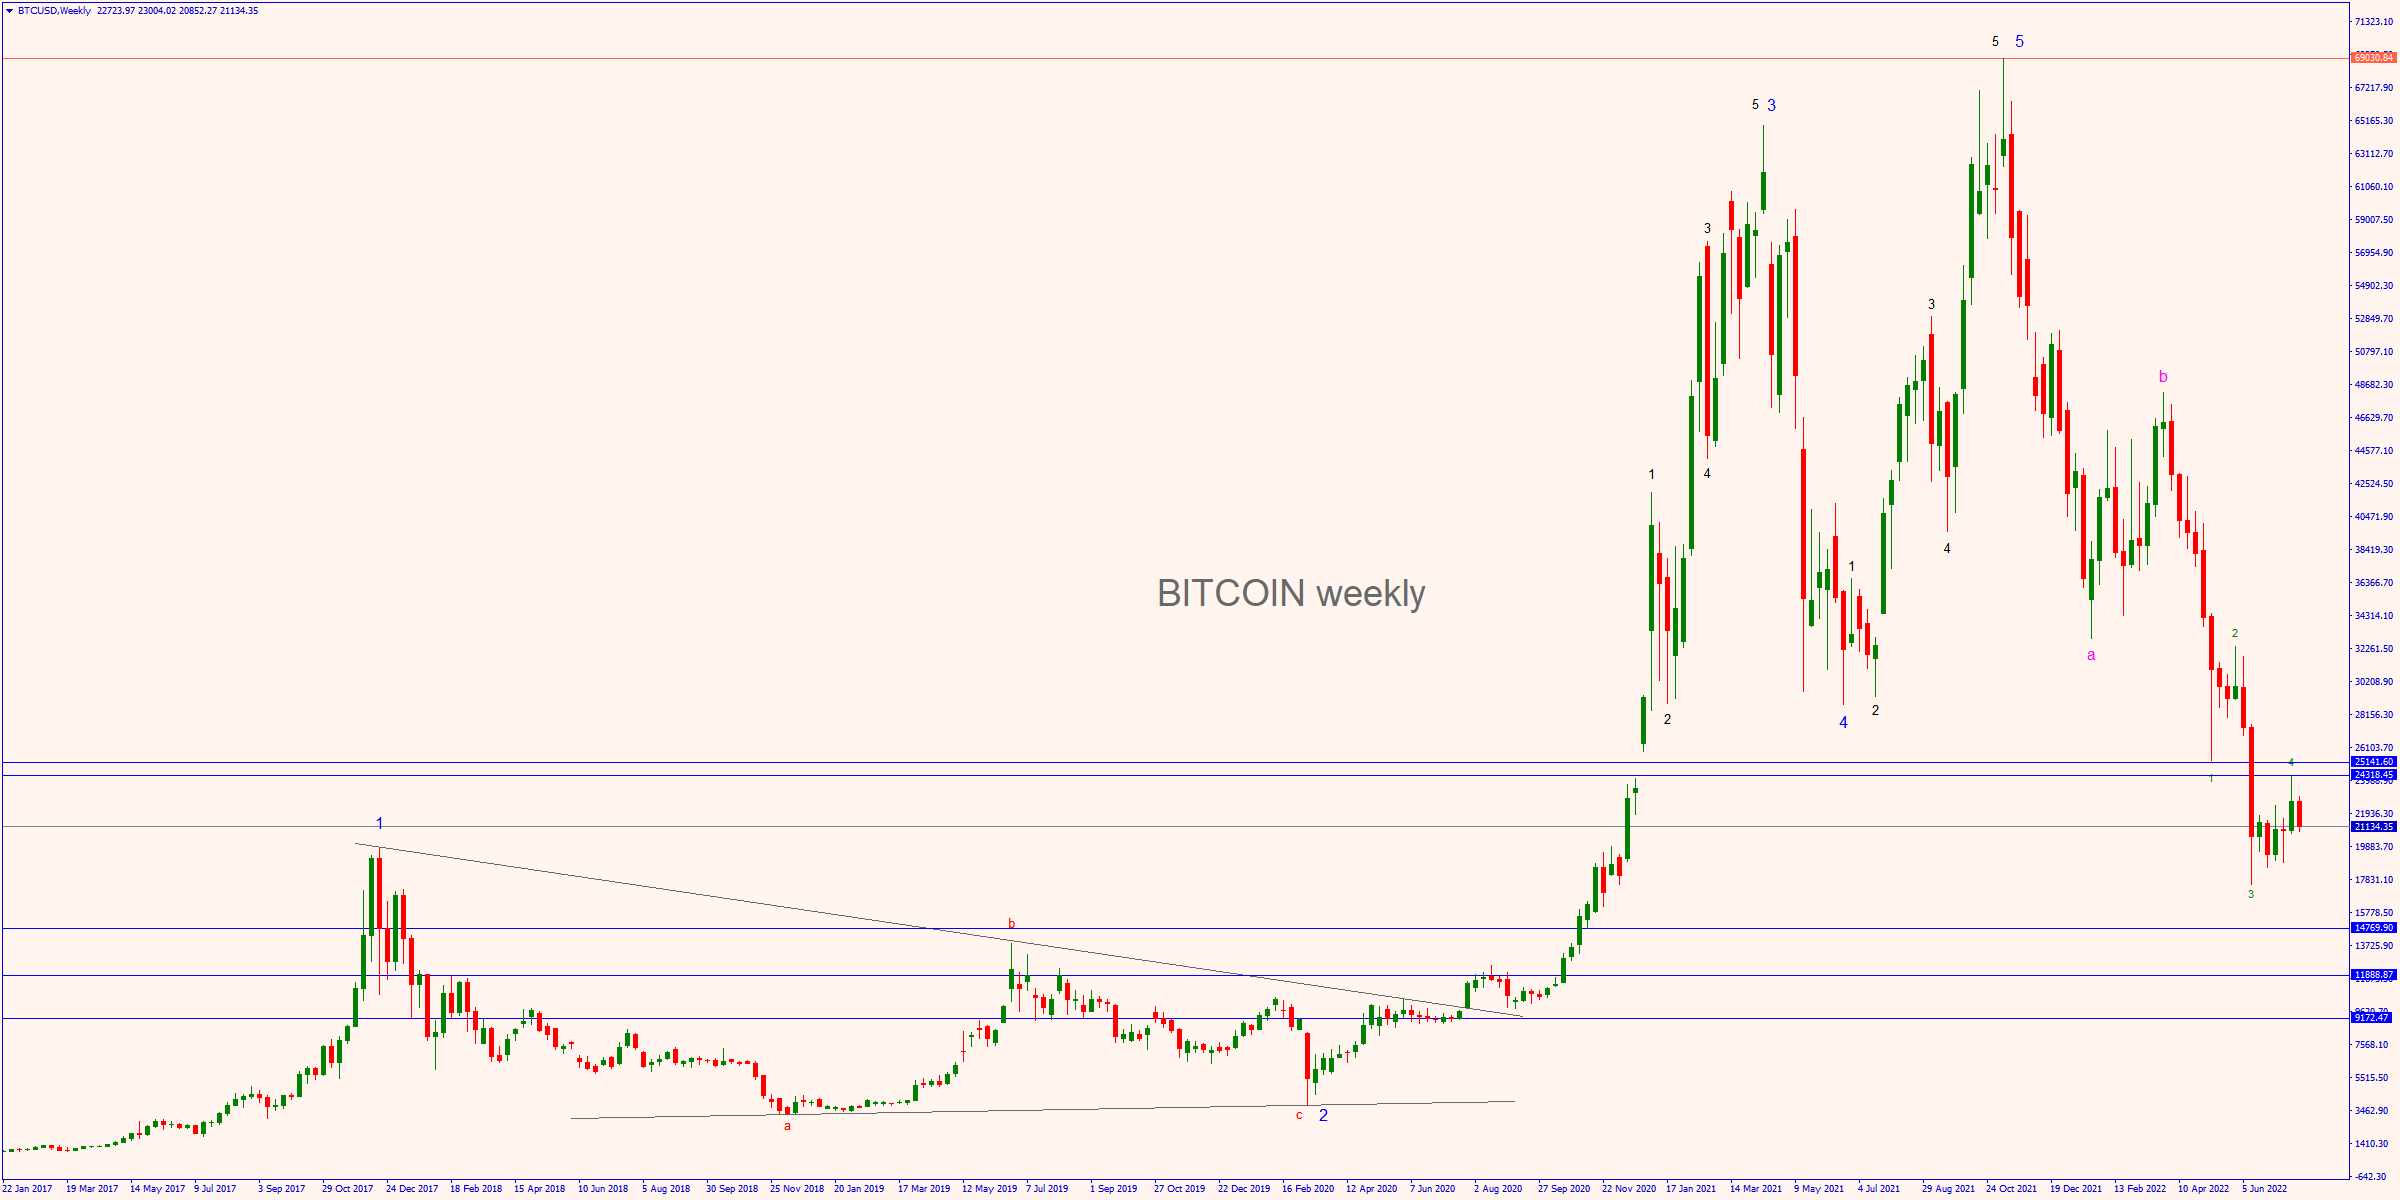

ELLIOTT WAVES

Bitcoin is soon to complete a major a-b-c wave started in Nov 2021 (see  the weekly chart)Note the targets: the three blue horizontal lines at 9172, 11888 and 14769. Bitcoin should land in that area.

The daily chart confirms the downtrend which will complete major wave C by  displaying four medium waves 1-2-3-4 - out of five - and four even smaller waves 1-2-3-4 - out of five.

Consequently, the expected new downtrend - called minor wave 5 - will also complete medium wave 5 as well as major wave C.

The 4-hours chart shows the a-b-c pattern which characterizes the typical retracement up of wave 4. That pattern should soon be followed by wave 5 downward (not displayed).


Bitcoin monthly. Click to enlarge


Bitcoin daily. Click to enlarge


Bitcoin 4-hours. Click to enlarge

Friday 19 March 2021

S&P 500 ready to sink?

 Hi Traders,

The S&P500 (now at 3920) ha completed the whole set of Elliott waves up and seems to be ready for a big dive to 3400.

ELLIOTT WAVES

The weekly chart reveals that It's topping. It could be the top of wave 3 (in blue).

The daily chart shows the reverse candlestick (runaway pattern ) at 553 and the likely target at 3391.6.

The 4-hours and the 1-hour charts display the reverse pattern at 55.


Weekly chart. Click to enlarge


Daily chart. Click to enlarge


4-hours chart. Click to enlarge


1-hour chart. Click to enlarge


Wednesday 6 January 2021

US dollar to strength soon

Hi Traders ,

The US dollar has reached the target and should gain versus all main currencies and commodities.

WTI OIL

WTI Oil price is now at $50 (right on the 61.8 Fibonacci target at $50-51). Besides, it has completed all waves up  (see weekly and daily chart). However, it might attempt a jump up to $54 before reversing.

AUDUSD

AUDUSD (now at 0.778) has completed all waves up and is on target to 0.78-0.80 where it could reverse (see weekly and daily chart). 

EURUSD

EURUSD  (now at 1.23) could temporarily reverse right were it is now, although the main target is still 1.30 (see weekly and daily chart).

GOLD

XAUUSD (now at 1944) might attempt 1965 before reversing temporarily (see weekly chart)

GBPUSD

The pound (now at 1.363) topped at the 1.37 target (see weekly and daily chart) and completed all waves up. It should reverse soon.


WTI weekly. Click the chart enlarge


WTI daily. Click the chart enlarge


AUDUSD weekly. Click the chart enlarge


AUDUSD daily. Click the chart enlarge


EURUSD weekly. Click the chart enlarge


EURUSD daily. Click the chart enlarge


Gold daily. Click the chart enlarge


GBPUSD weekly. Click the chart enlarge


GBPUSD daily. Click the chart enlarge

Thursday 23 July 2020

GOLD close to top?

Hi Traders,

Gold (now at 1883) is really close to the previous top at 1922. After that, it's uncharted territory. Hence, it might reverse anywhere between 1890 and 2100. Prepare for a roller coaster.

ELLIOTT WAVES

The monthly chart shows that the exponential rally started on Aug 16, 2018 has completed all five waves up and this seems to be confirmed by the weekly, daily, 4-hours charts and even the 1-hour chart.


Monthly chart. Click to enlarge


Weekly chart. Click to enlarge


Daily chart. Click to enlarge


4-hours chart. Click to enlarge


1-hour chart. Click to enlarge


Tuesday 9 June 2020

AUDUSD to top & reverse?

Hi Traders,

The AUDUSD (now at 0.7038) entered the target area 0.700-0.756 (see monthly, weekly and daily charts). It might top soon and temporarily reverse to the area 0.67-0.65.

ELLIOTT WAVES

The monthly, weekly and daily charts show the upper target area at 0.700-0.756.

The 4-hours chart reveals that the whole set of main waves and sub-waves is practically complete.

Note the last channel in the 4-hours chart and in the 1-hour chart: The show 4 or more contact points, meaning that a reverse is imminent.

However, be aware that the AUDUSD might attempt one last flicker to 0.71  before reversing to the area 0.67-0.65.


Monthly chart. Click to enlarge


Weekly chart. Click to enlarge


Daily chart. Click to enlarge


4-hours chart. Click to enlarge


1-hour chart. Click to enlarge


Wednesday 15 April 2020

WTI OIL to bounce back

Hi Traders,

Unless the WTI Oil drops below $19, it could recover to $42 or even 54.42.

ELLIOTT WAVES

In the monthly chart, the last candle is an inverted hammer. This implies a temporary rebound (therefore the downtrend should resume soon after) and also a rebound limited to $54.42. The most likely target should be $42.

The daily chart, the 4-hours chart and the 1-hour chart show that, unless the Oil drops below $19, the Elliott Wave pattern unfolding could be an AB+5

If this is the case, wave A and B have been completed and should be followed by 5 waves up, possibly to 54.42, more likely to 42.


Monthly chart. Click to enlarge


Weekly chart. Click to enlarge


Daily chart. Click to enlarge


4-hours chart. Click to enlarge


1-hour chart. Click to enlarge


Monday 8 July 2019

Gold turning South

Hi Traders,

Gold (now at 1405) initiated a sharp downturn that might drag it down to 1300 and below.

ELLIOTT WAVES

After the low at 5cthe monthly chart staged a 1-2-3-4-5 that seems to be completed. Consequently, Gold could start a downturn to the 1300 area.

This 5 waves pattern looks like a large Wave 4 of a downtrend. In this pattern, the first 4 legs are made out of 3 smaller waves and the last wave (wave 5) is made out of 5 waves.

All this religiously happened: see weekly and daily charts. NOTE: a further confirmation is provided by the Gann "throw over", that occurs where wave 5 shoots through the upper boundary of the wedge. See the daily chart.

The 4-hours chart displays the reverse pattern at 55C5.


Monthly chart. Click to enlarge


Weekly chart. Click to enlarge


Daily chart. Click to enlarge


4-hours chart. Click to enlarge


Thursday 23 May 2019

Red alert for the ASX 200

Hi Traders,

Although the ASX 200 (now at 6475) has still the potential to get to 6800, the current uptrend doesn't seem trustworthy anymore and it might be more prudent taking your profit home.


ELLIOTT WAVES

The monthly chart shows a pattern that could be a giant wave 4 unfolding with an a-b-c.  Wave b, made of 5 waves up, is almost complete (although unusually built of 5 waves up instead of 3 or 7 waves up). Still, however you want to put it, we might be close to a major top.

Note the theoretical target at 6680-6750.

The weekly and daily charts show that the ASX 200 unfolded an uptrend that  is suspiciously similar to a pattern called the-fifth-of-the-fifth-of-the-fifth.

This means that we might have seen a top - or be really close to a top - due to the completion of all the major and minor fifth waves.

Finally, the 4-hours chart displays a lot of dangerous reversal candlesticks as well a declining volume.


Monthly chart, Click to enlarge


Weekly chart, Click to enlarge


Daily chart, Click to enlarge


4-hours chart, Click to enlarge


Saturday 2 March 2019

WTI OIL just topped


Hi Traders,

For those who want to get to the professional level, please check my mentor program.


ANALYSIS


The WTI OIL (now at 55.73) just topped. Closest target: the area 53-51 (theoretically, 51.24).


ELLIOTT WAVES

The monthly chart reveals that the WTI OIL unfolded four major waves down (in magenta) and started major wave five downward after the top at 77.

In the weekly chart, the first part of major wave five (wave 1) took the Oil down to 42.35. Then retraced to 57.85 (wave 2) and now seems to be heading down again by starting wave 3.


The daily and 4-hours charts confirm that wave 2 was made of three waves up (as it's supposed to be). It also show a double top and reversal candlestick pattern, confirming that a top-and-reverse is in place.

Finally, the 1-hour chart shows a "breakaway pattern", meaning that the next movement should be down.

NOTE

There is still the chance that (in the weekly chart) this is a temporary retracement down.

If this is the case, the OIL could be stopped by the support around 51 and reverse. In so doing, it would make a new high anywhere between 64.80 and 93.60.

Instead, if the OIL crosses that support around 51, we need to consider 26.00 as the next support.


Monthly chart, click to enlarge


Weekly chart, click to enlarge


Daily chart, click to enlarge


4-hours chart, click to enlarge


1-hour chart, click to enlarge


Friday 22 February 2019

Gold just topped

Hi Traders,

For those who want to get to the professional level, please check my mentor program.


ANALYSIS


Although I thought that Gold (now at 1323) was going to top at 1333/4, it topped at 1346/7. The next leg should point down, starting with the target at 1236.


ELLIOTT WAVES


The monthly and weekly charts display a large wedge which is an  accumulation pattern (a-b-c-d-e). Theoretically, next large wave should tank from now on.

The daily chart and the weekly chart clearly show that the whole set of 5 waves up - from the bottom at d - is religiously in place. These waves formed wave e which topped right now.


Monthly chart. Click to enlarge


Weekly chart. Click to enlarge


Daily chart. Click to enlarge


4-hour chart. Click to enlarge


Wednesday 9 January 2019

The EURO to top soon?

Hi Traders,

The Euro (now at 1.146) might not make it through the 1.165 resistance. Hence, it could reverse course soon to target the area around 1.1040.


ELLIOTT WAVES


The monthly and weekly charts reveal some information:


1) The Euro is performing an a-b-c retracement wave from the top at 1.6037.


2) Wave c is sub-divided in 5 waves down. Wave four seems is
 fully deployed and wave five downward is already half away to 1.1040.

However, wave four can unfold with different shapes. In particular, it could evolve into a much large pattern which includes a rally to 1.27-1.30 before resuming the downtrend. We'll see.

The daily and 4-hours charts show that wave 5 (from the top at 4 in magenta) is currently unfolding with 5 minor waves, 3 fully deployed and the 4th one almost complete. If this is the case, minor wave five could be heading to 1.104 soon.


Monthly chart, click to enlarge


Weekly chart, click to enlarge


Daily chart, click to enlarge


4-hours chart, click to enlarge